

Valid biomarker signatures from liquid biopsies – how to standardise NGS
Posted: 6 December 2016 | Benedikt Kirchner (TUM School of Life Sciences and Ludwig-Maximilians-University Munich), Dominik Buschmann (TUM School of Life Sciences and Ludwig-Maximilians-University Munich), Michael W. Pfaffl (TUM School of Life Sciences) | No comments yet
The advent of next-generation sequencing (NGS) techniques has revolutionised transcriptomics research and opened numerous avenues for scientific and clinical applications. While reverse transcriptase quantitative real-time polymerase chain reaction (RT-qPCR) is still considered the gold standard of gene expression analysis, its high throughput, single-nucleotide resolution and ever-plummeting costs have made NGS an intriguing and increasingly accessible alternative to this classical method…
In addition to mere transcript quantification, RNA-Seq offers exciting new insights, such as the discovery of novel transcripts and detection of alternative splice variants, or chimeric transcripts. While DNA sequencing yields fascinating discoveries about the genomic makeup of target tissues, RNA-Seq might hold even greater potential for biomarker research and drug discovery.
Exploring the transcriptome, including mRNA and all classes of non-coding, regulatory RNAs, allows researchers to capture a dynamic snapshot of cellular activity – including regulatory adaptations – to a given physiological stimulus, response to treatment, or early onset of various diseases. The past few years have brought about huge interest in molecular diagnostics of various classes of regulatory RNAs, including long non-coding RNA (lncRNA) and smaller species such as microRNA (miRNA) and piwi-interacting RNA (piRNA)1.
Both their crucial role in physiological gene regulation and their deregulation in various maladies make small RNA an intriguing target molecule for diagnostic (biomarker research) and therapeutic (drug development) applications. While the idea of a single ‘golden bullet’ biomarker for a given condition seems appealing, precise disease detection and classification is usually only accomplished by a combined signature derived from the integrative analysis of several independent markers. Transcriptional biomarker signatures have the potential to detect the disease at low concentrations and in the early stages, and thereby provide guidelines for patient stratification, therapy and prognosis.
Drug Target Review has just announced the launch of its NEW and EXCLUSIVE report examining the evolution of AI and informatics in drug discovery and development.
In this 63 page in-depth report, experts and researchers explore the key benefits of AI and informatics processes, reveal where the challenges lie for the implementation of AI and how they see the use of these technologies streamlining workflows in the future.
Also featured are exclusive interviews with leading scientists from AstraZeneca, Auransa, PolarisQB and Chalmers University of Technology.
Applications
One of the most prominent applications is breast cancer management, where several transcriptional biomarker panels such as Oncotype DX, Mammaprint or Prosigna enhance personalised treatment by molecular profiling of the tumour. Besides shedding light on the cellular protein production machinery, RNA-Seq also provides insights into the world of extracellular nucleic acids. In particular, liquid biopsies – non- or minimally-invasive clinical tests on various biofluids – are currently one of the hottest topics in medical diagnostics and might just live up to the hype. A fast, cost-efficient and low-risk procedure, biofluid sampling offers many advantages over classical tissue biopsies. Various liquid biopsy-based clinical tests, ranging from Exosome Diagnostics’ ExoDx™ Prostate (IntelliScore) assay for stratification of patients with prostate-specific antigen (PSA) gray zone levels to the cobas® EGFR Mutation Test v2 (Roche Molecular Diagnostics) that detects epidermal growth factor receptor (EGFR) mutations in cell-free DNA from non-small cell lung cancer patients, are commercially available today2,3.
In addition to disease-induced changes in well-established blood markers such as extracellular DNA and circulating tumour cells (CTCs), numerous diseases have now been associated with altered profiles of extracellular small RNAs. These readily accessible species are either associated with proteins and lipoproteins or encapsulated in extracellular vesicles (EVs), both of which provide a protective shield against RNases in the blood. EVs also function as target tissue-specific delivery vehicles in long range intercellular communication. By reflecting the physiological or pathological state of secreting cells, EVs are considered an enriched sampling fraction in serum or plasma, and both vesicular nucleic acids and proteins were shown to be of interest in biomarker research4.
Analysing the treasure trove of vesicular small RNA is an area of worldwide interest and enthusiasm in basic research and medical diagnostics, but studies often lack statistical power, appropriate controls and detailed reporting. Rigorous standardisation and validation of experiments are crucial to ensure accuracy and reproducibility of biomarker studies, ultimately leading to better predictions in molecular diagnostics. We recently discussed the issue of optimising and standardising the entire small RNA-Seq workflow in great detail, and herein present a brief synopsis of key aspects5.
Sequencing success
The foundations for successful small RNA-Seq experiments are laid during experimental design, where factors such as replication, sequencing depth and statistical power need to be considered. Technical replicates help to reduce experimental noise and assess technical biases, but are oftentimes not implemented due to prohibitory sequencing costs. Biological replicates, on the other hand, are crucial to correct for endogenous intra-group variability and render statistical power to sequencing experiments.
Replication ultimately depends on both biological variability and the question at hand. Increased sample heterogeneity and precise in-depth detection of transcripts call for more biological replicates. Recent publications on RNA-Seq indicate a need for at least three to five biological replicates when the majority of differentially expressed genes is to be detected6. In the same vein, sequencing depth is dictated by the outcome of interest: a rough assessment of gene expression requires far lower coverage than the analysis of less abundant transcripts. For most applications, however, increasing biological replication is preferable over deeper sequencing, especially when working with samples featuring high biological variance such as clinical specimens from diseased patients.
Further pre-analytical factors that can set up experiments for success or failure are sampling, handling, and quality of biological material and the resulting RNA. Since sequencing results are predicated upon high-quality input material, the prompt preservation and stabilisation of specimens is crucial. Proper sampling and storage allow the extraction of RNA with high quality and integrity, which is crucial for any quantitative gene expression analysis. Thermal or enzymatic disintegration of RNA impairs the results of downstream expression profiling by microarray, RT-qPCR and NGS, and leads to a seemingly increased proportion of small RNAs that can be attributed to degradation products. The quality and integrity of input RNA should therefore be assessed by fluorescence-based capillary electrophoresis, as well as appropriate digital interpretation algorithms that calculate quality scores such as the widely adopted RNA integrity number (RIN).
Even with proper experimental design and sample handling, RNA extraction and library preparation bear the largest risk of bias introduction. The extraction of small RNAs from low concentration samples such as liquid biopsies is problematic, but can be improved by using carrier molecules such as glycogen7 and assessing efficiency and reproducibility with external spike-in controls8. Having extracted and quantified high-quality RNA, the next step towards expression profiling is library preparation – the process of converting native RNA into sequencable molecules. From adaptor ligation to reverse transcription, barcoding and amplification, library preparation requires multiple enzymatic reactions, each of which has the potential to introduce substantial bias. Being able to choose from a plethora of strategies and kits for small RNA library preparation is a blessing and a curse for researchers: gene expression results seem to depend heavily on the pre-sequencing chemistry that thus has to be carefully tailored to the respective experiment9.
The most common protocols include a ligation step that attaches adapters or barcodes to both ends of native small RNAs. Ligation efficiency was shown to depend on the sequence and structure of both RNA and RNA/adapter constructs, and can therefore vary greatly for different species and families of small RNA. It might be advisable to opt for adaptors with randomised sequences at the ligation junction in order to allow efficient attachment of all sequences in the sample. Additionally, ligation should be limited to flanking adaptors, and barcodes – short sequences that enable distinction of multiple samples in the same sequencing reaction – should be introduced exclusively during reverse transcription of adaptor-ligated small RNA, or later on during PCR amplification10.
Amplification efficiency
PCR specifically enriches functional molecules with adapters on both ends and thus massively increases the abundance of transcripts for sequencing. Amplification efficiency, however, is known to depend on template sequence, GC-content and enzyme/buffer composition – all of which need to be considered in order to avoid underrepresentation of certain sequences11. For minimal distortion and optimal comparability, it is recommended to use as few PCR cycles as possible and to only compare samples with the identical number of cycles12. Subsequent to amplification and cleanup, libraries need to undergo a rigorous size selection step to enrich for fragments in the appropriate size range, which ultimately increases purity and sequencing output. Both adapter dimers and non-target cDNA sequences need to be separated from the desired library preparation products. In small RNA-Seq, adaptor-transcript constructs oftentimes only differ by 20–30 bp from adapter dimers, which calls for precise size selection by high resolution gel electrophoresis12.
After excision and purification of target bands, library purity and length distribution should be assessed by high sensitivity capillary electrophoresis. Contaminating adapter dimers and fragments of degraded RNA are competitively sequenced and reduce the proportion of target small RNA reads13. The final step of a well-standardised library preparation workflow entails precise quantification of sequencing libraries, which is closely tied to optimal sequencing data. While flow cell overloading reduces overall read quality due to overlapping clusters, underclustering unnecessarily lowers sequencing output by squandering flow cell binding sites14. Spectrophotometrical and fluorometric quantification assays suffer from low sensitivity and concomitant detection of non-amplifiable molecules, single-stranded DNA and free nucleotides, and are therefore poorly suited. Quantification of only functional, adapter-ligated molecules by qPCR or digital PCR, on the other hand, ensures optimal cluster density and maximal output of high-quality sequencing data15.
Analysing the data
Successful sequencing generates millions and millions of reads that need to be processed and analysed properly in order to extract meaningful and reliable information. Although small RNA-Seq can be used in various routes of inquiry, the following discussion of data analysis will be centred on the arguably most prevalent application: differential gene expression (DGE) profiling. Prior to analysis, data require several pre-processing steps. Sequencing reads are initially trimmed of 3’-end adapter sequences, inevitably incorporated when sequencing small RNAs, and filtered for sequences with inadequate lengths. Removing reads shorter than 16–18nt that usually derive from degraded RNA or adapter dimers saves computational time for downstream analyses and significantly reduces false positive alignments. A number of programmes including Btrim, cutadapt and FaQCs are suited for this purpose. If sequencing quality is suboptimal, data can additionally be quality-trimmed by removing bases or reads with low quality scores using tools such as Cutadapt, Btrim or SolexaQA5.
Remaining reads should be devoid of low quality sequences and show a distinct peak for the targeted small RNA species. They can now be mapped to a reference database by indexing either the reads or the reference and aligning them both. Although there is no universal best mapping strategy, we recommend using well established tools such as Bowtie, BWA or SOAP25 and opting for reference indexing over read indexing. Even though mapping to a reference genome provides the most comprehensive view of sequencing data, specific databases of target RNAs (e.g. mirBase, Rfam16,17 ) are usually the preferable mapping reference due to more extensive annotations and reduced computational efforts.
Normalising the data
Subsequent to mapping sequences to the corresponding database and counting reads with the same feature, RNA-Seq data have to be normalised to compensate for technical bias introduced by varying sequencing depth, GC content or batch effects between libraries or sequencing runs. The still-popular strategies of normalising to reads per kilobase per million mapped reads (RPKM) or library size are ill-suited for the particular nature of small RNA-Seq. Several methods more appropriate for various experimental designs have been developed and should be carefully considered for the respective experiment. Generally, median normalising of expression ratios from geometric means – found in the popular R packages DESeq and DESeq2 – seems to work well for many data sets18.
Once appropriately preprocessed and normalised, RNA-Seq data is ready for the final and core step of the data analysis workflow: differential expression analysis. Although the random sampling nature of sequencing a single sample can be decently modelled to a Poisson distribution, biological replicates are very likely to show greater variances than expected by this mathematical model. This so-called overdispersion greatly underestimates sampling errors and needs to be corrected for in order to keep false-positive rates at bay. Several tools taking a weighted likelihood approach towards the common dispersion (edgeR) or modelling the observed mean-variance relationship for all genes (DESeq), are suited for DGE analysis of small RNA-Seq data. Even more so than for data preprocessing tools, DGE software needs to fit the experiment at hand: while SAMSeq works well for experiments with larger sample sizes, edgeR and DESeq are the methods of choice for smaller data sets. Additionally, edgeR seems to outperform DESeq when the number of biological replicates is low6.
Validation
Having identified biomarker candidates in DGE profiling, these markers need to be validated by multivariate statistical analyses. By first screening data in an unsupervised manner with clustering algorithms including principal component analysis (PCA) or hierarchical clustering (HCA), and subsequently assessing the discriminative power of biomarker candidates by supervised methods, small RNAs responsible for separating sample groups can be reliably identified. Complementary in silico target prediction, orthogonal confirmation by RT-qPCR, and functional validation in overexpression or knockdown experiments, help establish the biological roles of biomarkers.
In the context of molecular diagnostics and clinical research, RNA-Seq does not only offer exciting possibilities for the discovery of deregulated RNAs, tissue- or disease-specific isoform profiles and transcriptional aberrations, such as fusion genes, but can also be applied to drug discovery. Various intra- and extracellular small RNAs were shown to robustly correlate to maladies in a causative or disease-associated manner. Assessing changes in gene expression by transcriptome sequencing therefore aids in both identifying potential therapeutic targets and establishing the molecular mode of action of a drug.
Substantial research in the past has led to the US Food and Drugs Administration approving several RNA-Seq-based biomarker signatures that are available to clinicians today. Additionally, there are a number of promising miRNA-targeting drug candidates and experimental drugs, such as the short antisense RNA Miravirsen, which sequesters liver miR-122 in hepatitis C patients, in pre-clinical and clinical trials19. Present and future therapeutic applications of small RNA range from specifically depleting pathogenic miRNAs to reinstalling a healthy population of disease-repressed nucleic acids and potentially even inducing gain of functions to target cells.
Biographies
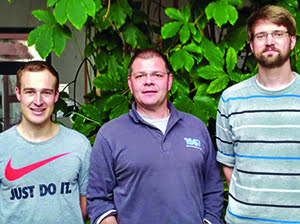
Left to right: Dominik Buschmann, Michael W. Pfaffl & Benedikt Kirchner
MICHAEL W. PFAFFL is Professor of Molecular Physiology at the Technical University of Munich in Freising Weihenstephan, heading the Animal Physiology group and has reached the PI status at the Department of Animal Physiology & Immunology. He is one of the leading scientists concerning RT-qPCR technology and its data analysis in mRNA and small-RNA expression profiling and is author of around 160 peer reviewed publications, 40 book chapters and more than 200 lectures worldwide.
After finishing his Master’s degree in biology at the Technical University of Munich in Freising Weihenstephan in 2010, BENEDIKT KIRCHNER started his PhD study at the Department of Animal Physiology & Immunology under the supervision of Prof. Michael Pfaffl. Coming from a background of gene expression analysis in a range of biofluids, he is currently focusing on the intricacies of NGS data analysis especially in small non-coding RNA and distribution changes of intra- and extracellular RNA related to various physio- and pathophysiological conditions.
DOMINIK BUSCHMANNreceived his Bachelor’s degree in molcular biotechnology from the Technical University of Munich in 2011. During his Master’s degree, he studied bovine extracellular vesicles in Michael W. Pfaffl’s lab. He is currently enrolled as a PhD student at the Technical University of Munich and the Ludwig-Maximilians-University Munich, where he is involved in the holistic characterisation and transcriptomic analysis of extracellular vesicles in critically ill patients with a focus on small RNA expression profiling.
References
- Byron SA, Van Keuren-Jensen KR, Engelthaler DM, Carpten JD and Craig DW. Translating RNA sequencing into clinical diagnostics: opportunities and challenges. Nat Rev Genet. 2016; 17, 257-271
- McKiernan J, Donovan MJ, O’Neill V, Bentink S, Noerholm M, Belzer S, Skog J, Kattan MW, Partin A, Andriole G, et al. A Novel Urine Exosome Gene Expression Assay to Predict High-grade Prostate Cancer at Initial Biopsy. JAMA Oncol. 2016; 2, 882-889
- Brown P. The Cobas(R) EGFR Mutation Test v2 assay. Future Oncol. 2016; 12, 451-452
- Yokoi A, Yoshioka Y, Ochiya T. Towards the realization of clinical extracellular vesicle diagnostics: challenges and opportunities. Expert Rev Mol Diagn. 2015; 1-12
- Buschmann D, Haberberger A, Kirchner B, Spornraft M, Riedmaier I, Schelling G, Pfaffl MW. Toward reliable biomarker signatures in the age of liquid biopsies – how to standardize the small RNA-Seq workflow. Nucleic Acids Res. 2016; 44, 5995-6018
- Schurch NJ, Schofield P, Gierliński M, Cole C, Sherstnev A, Singh V, Wrobel N, Gharbi K, Simpson GG, Owen-Hughes T, et al. How many biological replicates are needed in an RNA-seq experiment and which differential expression tool should you use? RNA; 2016
- McAlexander MA, Phillips MJ, Witwer KW. Comparison of Methods for miRNA Extraction from Plasma and Quantitative Recovery of RNA from Cerebrospinal Fluid. Frontiers in Genetics. 2013; 4
- Burgos KL, Javaherian A, Bomprezzi R, Ghaffari L, Rhodes S, Courtright A, Tembe W, Kim S, Metpally R and van Keuren-Jensen K. Identification of extracellular miRNA in human cerebrospinal fluid by next-generation sequencing. 2013; 19, 712–722
- Linsen SE, de Wit E, Janssens G, Heater S, Chapman L, Parkin RK, Fritz B, Wyman SK, de Bruijn E, Voest EE, et al. Limitations and possibilities of small RNA digital gene expression profiling. Nat Methods. 2009; 6, 474-476
- Van Nieuwerburgh F, Soetaert S, Podshivalova K, Ay-Lin Wang E, Schaffer L, Deforce D, Salomon DR, Head SR, Ordoukhanian P. Quantitative bias in Illumina TruSeq and a novel post amplification barcoding strategy for multiplexed DNA and small RNA deep sequencing. PLoS One. 2011; 6, e26969
- Aird D, Ross MG, Chen WS, Danielsson M, Fennell T, Russ C, Jaffe DB, Nusbaum C, Gnirke A. Analyzing and minimizing PCR amplification bias in Illumina sequencing libraries. Genome Biol. 2011; 12, R18
- Head SR, Komori HK, LaMere SA, Whisenant T, Van Nieuwerburgh F, Salomon DR, Ordoukhanian P. Library construction for next-generation sequencing: overviews and challenges. Biotechniques. 2014; 56, 61-64, 66, 68, passim
- Buehler B, Hogrefe HH, Scott G, Ravi H, Pabon-Pena C, O’Brien S, Formosa R, Happe S. Rapid quantification of DNA libraries for next-generation sequencing. Methods. 2010; 50, S15-18
- Quail MA, Kozarewa I, Smith F, Scally A, Stephens PJ, Durbin R, Swerdlow H, Turner DJ. A large genome center’s improvements to the Illumina sequencing system. Nat Methods. 2008; 5, 1005-1010
- Robin JD, Ludlow AT, LaRanger R, Wright WE, Shay JW. Comparison of DNA Quantification Methods for Next Generation Sequencing. Sci Rep. 2016; 6, 24067
- Kozomara A, Griffiths-Jones S. miRBase: annotating high confidence microRNAs using deep sequencing data. Nucleic acids research. 2014; 42, D68-73
- Nawrocki EP, Burge SW, Bateman A, Daub J, Eberhardt RY, Eddy SR, Floden EW, Gardner PP, Jones TA, Tate J, et al. Rfam 12.0: updates to the RNA families database. Nucleic acids research. 2015; 43, D130-137
- Zyprych-Walczak J, Szabelska A, Handschuh L, Górczak K, Klamecka K, Figlerowicz M, Siatkowski I. The Impact of Normalization Methods on RNA-Seq Data Analysis. BioMed research international. 2015; 621690
- Matsui M, Corey DR. Non-coding RNAs as drug targets. Nat Rev Drug Discov. 2016
Related topics
Biomarkers, DNA, Drug Discovery, miRNAs, Next Generation Sequencing (NGS), RNAs, Sequencing