

Visualising the effects of targeted therapies on patient tumours
Posted: 11 September 2017 | James O’Connor | No comments yet
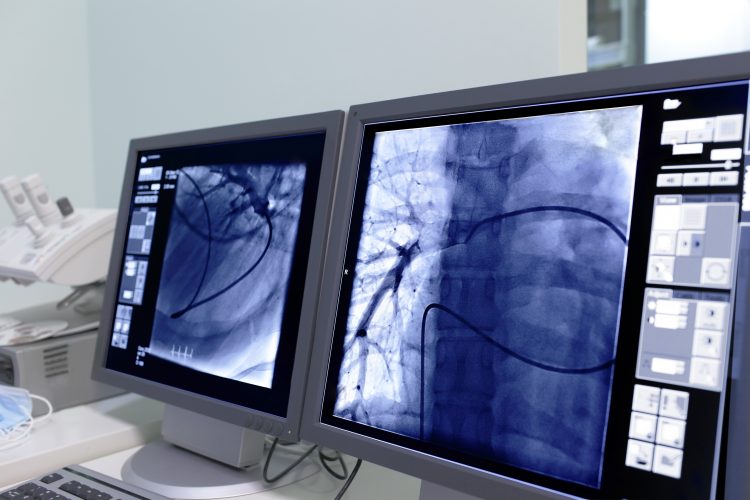
The development of technology that can ‘see’ inside our bodies is one of the great achievements of modern medicine.1 For over 100 years, doctors have used imaging methods for this very reason to help guide patient care. Initially, two-dimensional x-ray pictures of bones and chests were used to help diagnose fractures and common lung diseases such as tuberculosis infection respectively.
However, in the last few decades the possibilities that medical imaging can offer have expanded hugely. This article considers the background to radiology in general, focuses on how pharmaceutical companies have used medical imaging in oncology drug development, and discusses how imaging may further assist strategic decision making in bringing new drugs to market.
In the 1970s computed tomography (CT) was introduced into medical practice. Here, physics and engineering sciences had combined to produce a technique capable of mapping the inner structures of the entire human body.2 The pioneers of CT realised that individual x-rays taken at multiple external reference points could be combined mathematically to create a three-dimensional picture. Not only did flat images of vital organs such as the lungs become three dimensional, but CT also enabled organs that had been very difficult to visualise, such as the brain, to become visible. Further, sophisticated ways of displaying these images allowed scientists to discriminate different soft tissue structures. This enabled organs to be distinguished from one another and allowed detection of tumours within solid organs. The advent of CT transformed the way in which neurological, oncological and other medical conditions were diagnosed and monitored.
 Over subsequent years, the speed, functionality and versatility of CT has improved immeasurably and – in combination with excellent patient compliance – this means that CT has revolutionised the way in which patients are investigated. The availability of magnetic resonance imaging (MRI) has extended these advances even further. Clinical MRI is a complex imaging method where tissues can be imaged by applying a radio-frequency pulse to tissue protons and then measuring how the protons lose the energy they gained from the radio-frequency pulse. By altering settings on the scanner, different aspects of tissue physiology can be emphasised. Although MRI scans take longer to acquire, they provide even greater tissue contrast than CT in many body parts.3
Drug Target Review has just announced the launch of its NEW and EXCLUSIVE report examining the evolution of AI and informatics in drug discovery and development.
In this 63 page in-depth report, experts and researchers explore the key benefits of AI and informatics processes, reveal where the challenges lie for the implementation of AI and how they see the use of these technologies streamlining workflows in the future.
Also featured are exclusive interviews with leading scientists from AstraZeneca, Auransa, PolarisQB and Chalmers University of Technology.
In addition, MRI has contributed to a second major advance – the ability of imaging to map the functional and molecular physiology in patients, as well as map anatomy and physiology. This has been achieved in three main ways: by manipulating the ways in which protons in fluid and tissues are magnetised; by performing complex image processing to measure aspects of tissue function such as perfusion, oxygen delivery or water diffusion; and by imaging different nuclei such as phosphorous or sodium. On this last point, most recently scientists have successfully used MRI to image carbon nuclei in patients, thereby mapping the cellular organic biochemistry in humans.
The ability to image tissue function and molecular physiology extends beyond MRI. For decades, single photon emission computed tomography (SPECT) methods have enabled organ and tissue function to be measured. Examples include scanning lungs for pulmonary emboli and scanning bones to detect various diseases including infection and cancer. In the last two decades, positron emission tomography (PET) scanning has become increasingly available and is now used routinely in healthcare. While the number of radiotracers in clinical use is limited – the majority of cancer scans use the glucose analogue (in 18F FDG PET) to image metabolism – the number of potential applications are vast. Techniques can measure physiological processes such as perfusion, as well as detect abnormal levels of oxygen, cell turnover or metabolism in cancer. PET can also be used to label molecular pathways (for example, expression of EGFR or VEGF/VEGFR) or surface antigens (for example expression of PD-1), as well as drugs that target these pathways.4
Defining response and progression
Pharmaceutical companies rely on imaging to determine whether trial therapies provide patient benefit. Readers will no doubt be familiar with the use of medical imaging – most often CT, but now increasingly MRI or ^18F FDG PET – to assess response in clinical trials of cytotoxic chemotherapy, radiotherapy and targeted therapies. This application began in the 1970s, building on earlier work using x-ray and ultrasound evaluation, and became codified in World Health Organization (WHO) ‘response criteria’. These technologies, along with clinical evaluation, basic blood tests and x-rays, help determine whether individual patients with cancer show response to therapy or disease progression during or following therapy.
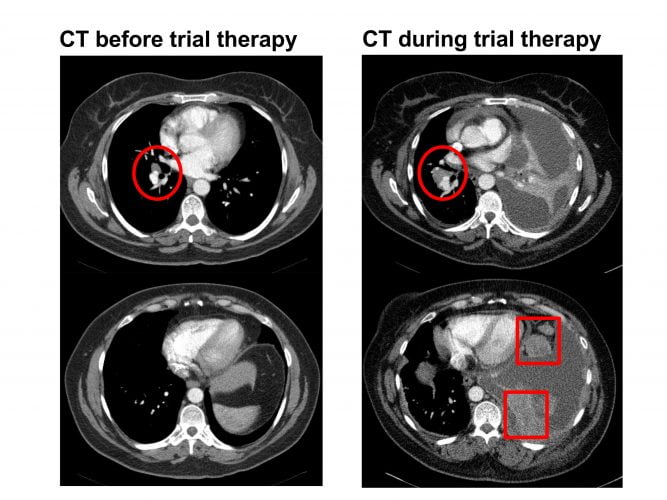
Figure 1: CT scan in a patient with stage IV non-small cell lung cancer on a clinical trial. The left-hand-side images show a small right hilar nodal mass (red circle). The right-hand-side images show increase in the right hilar mass (red circle) along with new upper abdominal omental disease (red squares) and ascites. The left lung volume is also reduced due to lobar collapse which raises the left hemi-diaphragm. The CT shows progression while on therapy.
Today, WHO criteria have been replaced by RECIST and other categorisation systems, but they still define response and progression (Figure 1). In oncology, the US Food and Drug Administration (FDA) has used objective response rate (based largely on imaging) as a surrogate endpoint in the accelerated approval of 12 targeted agents from 2010 to 2014.5 In addition, many more drugs have been approved on progression-free survival or other similar endpoints, where imaging has contributed to defining tumour progression.
Molecular imaging can play a critical role here.18F FDG PET can demonstrate dramatic responses in patients undergoing targeted therapy, for example, in gastrointestinal tumours treated with the c-Kit inhibitor imatinib, where conventional CT shows little change in tumour size. Continued research efforts are required to determine how these observations should be incorporated into tumour-drug specific response criteria; this process has begun and is likely to occur increasingly over the next few years.6
Some response assessment questions still require new solutions. One of the most exciting developments in targeted therapeutics is the demonstration that immune checkpoint inhibition can have dramatic clinical benefit in patients with solid tumours such as melanoma. However, not all patients respond and at present both conventional CT and also 18F FDG PET fail to distinguish patients with true progressive disease from those with so-called ‘pseudo-progression’ where inflammatory or other changes in the tumour cause swelling and tracer uptake that then subside as the cancer responds. This requires urgent development of new imaging methods to assist both drug developers and clinicians.
Selecting drug dose and schedule
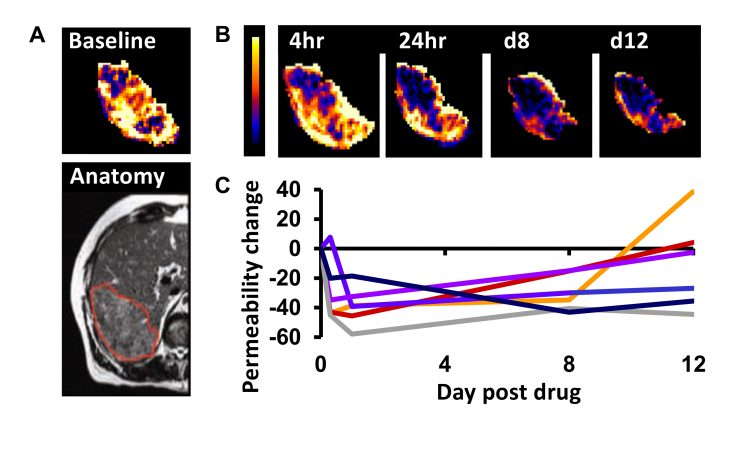
Figure 2: Example DCE–MRI in patients with stage IV colorectal cancer receiving the VEGF inhibitor bevacizumab. A) Baseline imaging maps the vessel permeability in a liver metastasis in a patient. B) Serial mapping of vessel permeability in the same tumour reveals pharmacodynamic changes within 4 hours of starting therapy which persist to day 12. C) The change in vessel permeability is plotted in tumours from six patients. Adapted with permission from: O’Connor. Nat Rev Clin Oncol. 2017;14:169-186.
In the last two decades, many pharmaceutical companies have investigated if and how functional and molecular imaging can assist dose selection. One widely-used application uses MRI and CT to estimate tumour perfusion, blood vessel volume and vessel leakage. These indicators (biomarkers) can quantify changes in tumours induced by therapies that target the tumour vasculature (Figure 2). Evidence from over 100 studies is clear that these biomarkers identify biologically active dose levels for anti-vascular drugs and that this information can determine optimum scheduling.7 Crucially, the functional MRI and CT estimates of perfusion, blood vessel volume and vessel leakage identify drug effect before significant changes in size can be detected.
As the number of targets increase, scientists must develop new methods to image the target and the effects of a successful therapeutic blockade. Each year many thousands of imaging biomarkers are developed to do just this, but so far the conversion rate from idea to clinically useful biomarker is very low. Identifying this problem, imaging scientists have understood the need to develop a roadmap to optimise how biomarkers can be translated into clinical use.8 This approach recognises that developing imaging tests has much in common with developing the drugs that require testing. Just as candidate drugs must be evaluated and then encounter go/no-go decision making, so candidate imaging biomarkers must be and stopped when they fail to show enough promise for further time and financial investment.
Informing drug PK and demonstrating mechanism of action
Imaging can be used to measure directly the pharmacokinetics (absorption, distribution, metabolism, excretion) of a drug and also to understand a drug mechanism of action (MoA). These are aspects of the ‘pharmacologic audit trail’ where the performance of a drug is assessed in multiple different steps.^9 For example, imaging – particularly PET and SPECT – can demonstrate receptor occupancy by drugs in a study. In addition, imaging can provide strong evidence that a drug hits the intended target. There is extensive evidence that CT or MRI perfusion biomarkers demonstrate MoA for anti-vascular agents and that 18F FDG PET biomarkers demonstrate MoA for PI3 kinase/AKT/mTOR pathway inhibitors.10
Tying imaging to biology and therapeutics has an ultimate goal: to develop imaging biomarkers as companion diagnostics. Precedent is already set. The MRI susceptibility relaxation signal is accepted as a companion diagnostic to aid in the identification and monitoring of non-transfusion dependent thalassemia patients receiving therapy with deferasirox.11 In oncology, the EMA Committee for Medicinal Products for Human Use recommended folate receptor-positive status assessed using 99mTc-etarfolatide scintigraphy for approval as a companion diagnostic in patients with platinum-resistant ovarian cancer treated with vintafolide.12 This recommendation was conditional on the outcome of the PROCEED trial of vintafolide, which reported negative results, but nevertheless this set an important regulatory precedent.
Summary
Imaging is used in drug development to define individual and group response and progression, to select optimum dose and schedule, and to inform drug mechanism of action. Currently, intense effort is being made to make imaging even more useful, by using existing imaging methods more rationally in drug development and by developing methods that image new drug targets.
About the author
James O’Connor MD, PhD, is a Cancer Research UK Clinician Scientist Fellow and Research Group Leader at the University of Manchester. He also practices Radiology at the Christie Hospital. He graduated in medicine from the University of Cambridge and University of London and specialises in translating MRI biomarkers into early-phase clinical trials to guide decision making.
References
- Looking back on the millennium in medicine. N Engl J Med. 2000;342:42-49.
- Hounsfield GN. Computed medical imaging. Science. 1980;210:22-28.
- Gadian DG. NMR and its applications to living systems. Oxford; New York: Oxford University Press. 1995.
- O’Connor JP, Jackson A, Asselin MC, Buckley DL, Parker GJ, Jayson GC. Quantitative imaging biomarkers in the clinical development of targeted therapeutics: current and future perspectives. Lancet Oncol 2008; 9:766-776.
- www.fda.gov/downloads/NewsEvents/Testimony/UCM445375.pdf (accessed 30th November 2015).
- Michaelis LC, Ratain MJ. Measuring response in a post-RECIST world: from black and white to shades of grey. Nat Rev Cancer. 2006;6:409-414.
- O’Connor JP, Jackson A, Parker GJ, Roberts C, Jayson GC. Dynamic contrast-enhanced MRI in clinical trials of antivascular therapies. Nat Rev Clin Oncol. 2012;9:167-177.
- O’Connor JPB, Aboagye EO, Adams JE, Aerts HJWL, Barrington SF, Beer AJ, et al. Imaging Biomarker Roadmap for Cancer Studies. Nat Rev Clin Oncol. 2017;14:169-186.
- Workman P, Aboagye EO, Chung YL, Griffiths JR, Hart R, Leach MO, et al. Minimally invasive pharmacokinetic and pharmacodynamic technologies in hypothesis-testing clinical trials of innovative therapies. J Natl Cancer Inst. 2006;98:580-598.
- Engelman JA. Targeting PI3K signalling in cancer: opportunities, challenges and limitations. Nat Rev Cancer. 2009;9:550-562.
- www.fda.gov/MedicalDevices/ProductsandMedicalProcedures/InVitroDiagnostics/ucm301431.htm (accessed 8 October 2015).
- European Medicines Agency Committee for Medicinal Products for Human Use. Summary of opinion (initial authorisation): Vynfinit vintafolide EMA/CHMP/138539/2014 ema.europa.eu (Accessed 30 November 2015).
Related topics
Computerised tomography (CT), Imaging
Related organisations
The University of Manchester
Related people
James O'Connor